GRADEBOOK TOOLS BLOG
How does a grade curve work?
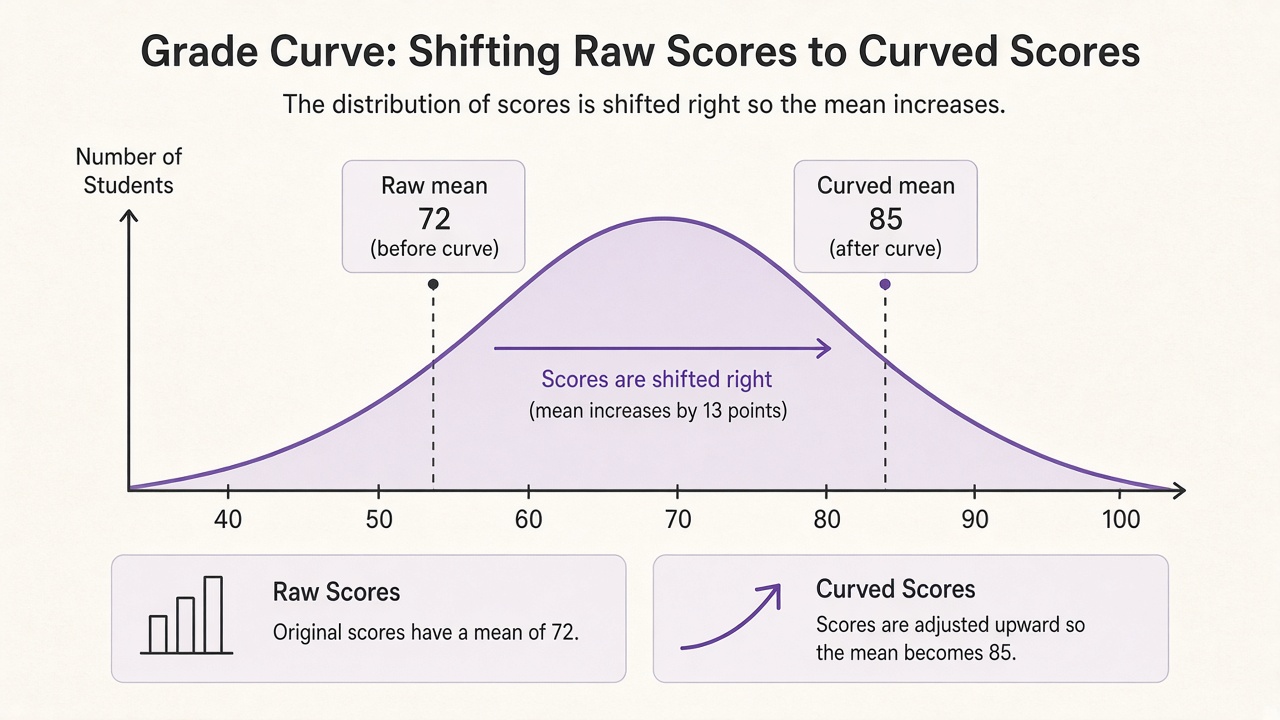
Short answer: A grade curve remaps every raw score with a published rule—often a mean shift, a linear scale to a new top score, or a square-root curve. If the class mean is 72 and the instructor shifts everyone +13, the new mean is 85.
Why instructors curve
Curves adjust for an unexpectedly hard exam or to match a department target distribution. A fair curve is announced with a formula so every student can verify their new score. Opaque “I’ll bump a few people” adjustments are a different practice.
Method 1 — Mean shift (flat bump)
Add the same number of points to every score: new = raw + (target mean − raw mean).
Shift = 85 − 72 = 13 → 70 becomes 83, 80 becomes 93.
Ranks stay the same. Scores can exceed 100% unless the instructor caps them.
Method 2 — Linear scale
Map the lowest and highest raw scores (or a chosen floor/ceiling) onto a new range. Example: stretch raw 50…100 onto curved 60…100 so the top paper becomes a perfect score and the bottom rises modestly.
Linear scales change gaps: students near the top may move more than students near the middle, depending on the anchors chosen.
Method 3 — Square-root curve
A common classroom shortcut: new% = 10 × √(raw%). A raw 64 becomes 10 × 8 = 80. It lifts lower scores more than high ones and still needs a clear cap/policy statement.
What a curve is not
- Not automatic letter-grade redistribution unless the syllabus says so.
- Not the same as dropping the lowest quiz—that is a separate gradebook rule.
- Not a substitute for fixing category weights; curve first or weight first should be explicit.
Student checklist
- Ask which method and whether scores are capped at 100%.
- Recompute your curved score with the published formula.
- Recalculate the course grade with the gradebook calculator or plan the final with the final grade calculator.
Teachers can paste a whole class list into the grade curve calculator to preview mean-shift, linear, and square-root results side by side.
Worked linear-scale numbers
Suppose raw scores run from 50 to 100 and the instructor maps that span onto 60 to 100:
For raw 50 → 60; raw 75 → 80; raw 100 → 100.
Compare with a flat +10 mean shift: every score rises equally, so a 75 becomes 85. The linear map and the mean shift answer different policy goals—confirm which one is on the syllabus.
After the curve, recompute the course
Replace the exam category average with the curved value, then re-run category weights. A curve on one midterm does not automatically raise homework. Students who only look at the curved exam percentage often mis-estimate the course grade until they update the full weighted gradebook.
Teacher workflow that stays defensible
- Grade the exam raw and compute the raw mean and range.
- Choose a method that matches the syllabus language (shift, scale, or root).
- Publish the formula before releasing curved scores.
- Apply the same formula to every paper—no silent individual bumps mixed into the curve.
- Store both raw and curved columns so disputes can be audited.
Students defending a score should recompute with the published formula, not with a guessed letter-curve (“top 10% get As”). Letter curves and numeric remaps are different instruments; mixing their vocabulary creates false expectations.
Square-root examples beside a mean shift
Raw scores 49, 64, and 81:
- Square-root curve: 10√49 = 70, 10√64 = 80, 10√81 = 90
- Mean-shift +8: 57, 72, 89
The square-root curve lifts the lowest score more (+21 vs +8) while the top score rises less (+9 vs +8). Neither method is universally “fairer”; fairness is whether the rule was announced and applied uniformly.